DataLake
The entire concept of a Data Operations Platform rests on top of a Data Lake. There is no simple definition of a Data Lake, but based on the author’s experience in implementing Data Lakes we can summarise by saying a Data Lake ‘simplifies and shares’ data across a VLE. For this proposal the Data Lake would be AWS and primarily S3 object store, a service and store that the author has 15 years of experience in using. S3 is infinitely scalable and has API integration with compute and consumption tooling.
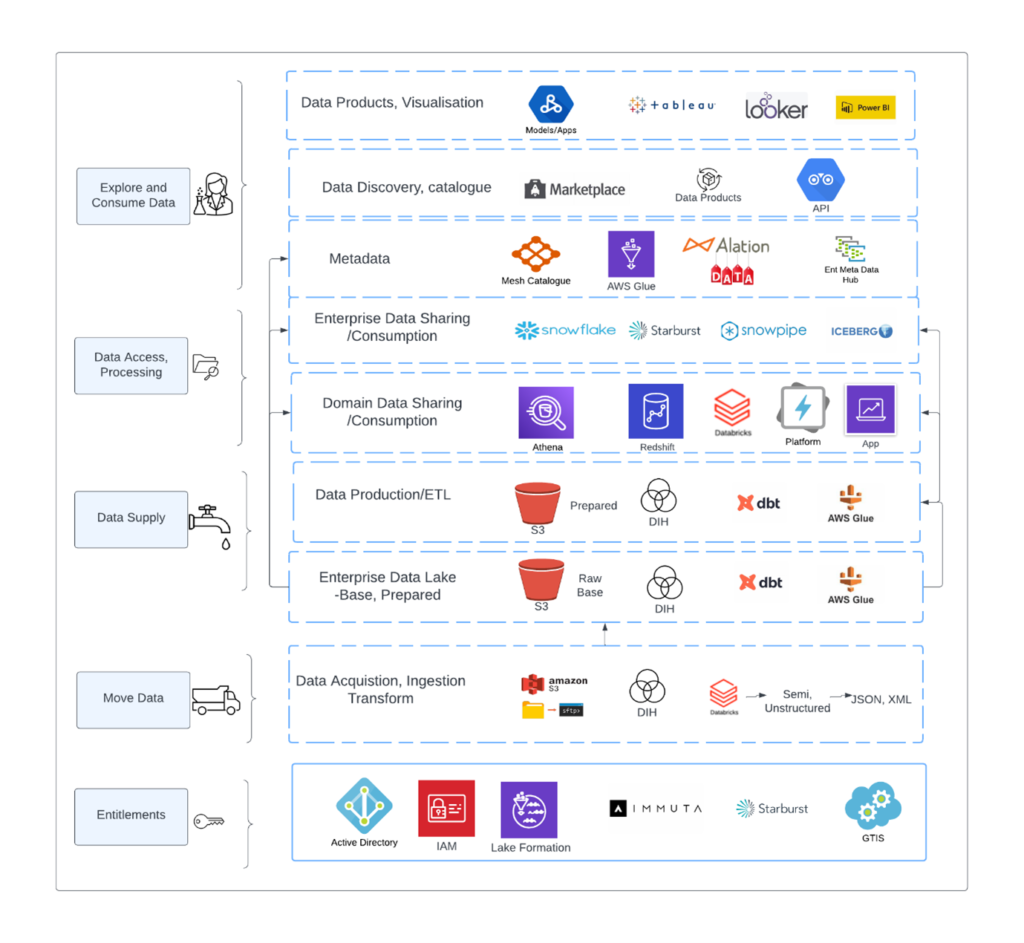
The figure below shows a typical Data Lake ‘stack’. Let’s ignore for the moment all the technologies. For example, Snowflake, a petabyte scale columnar database can and is used as a Data Lake in many firms. Its great advantage is seamless data sharing. We can easily extend our AWS S3 Data Lake to Snowflake or Databricks and other platforms, based on ‘use cases’ and requirements. The intent of this diagram is simply to show the many components which make up a ‘Data Lake’. Complex indeed.
Figure: Data lake complexity
Flows and Complexity
The above diagram is a typical example of Data Lake and Data Operations complexity. The author includes this to properly frame the discussion and intent of the research, which is to build a platform framework which will abstract away much of this complexity.
The diagram below helps to clarify this. In most very large enterprises (VLEs), Data Lakes are proving to be a blessing and a curse. This is due to many factors, an important one being the lack of automation of the Data Operations stack. A fundamental part of this is the lack of Agility within the processes, manual interventions, lack of standardised tooling and platforming and a lack of skills (never underestimate the skills needed for DataOps and the training involved). A platform which abstracts the myriads of interfaces, sources, destinations, ingestion processes and transformation points would be a significant and industry-changing solution for Data Operations.
Figure: Data Operations simplified
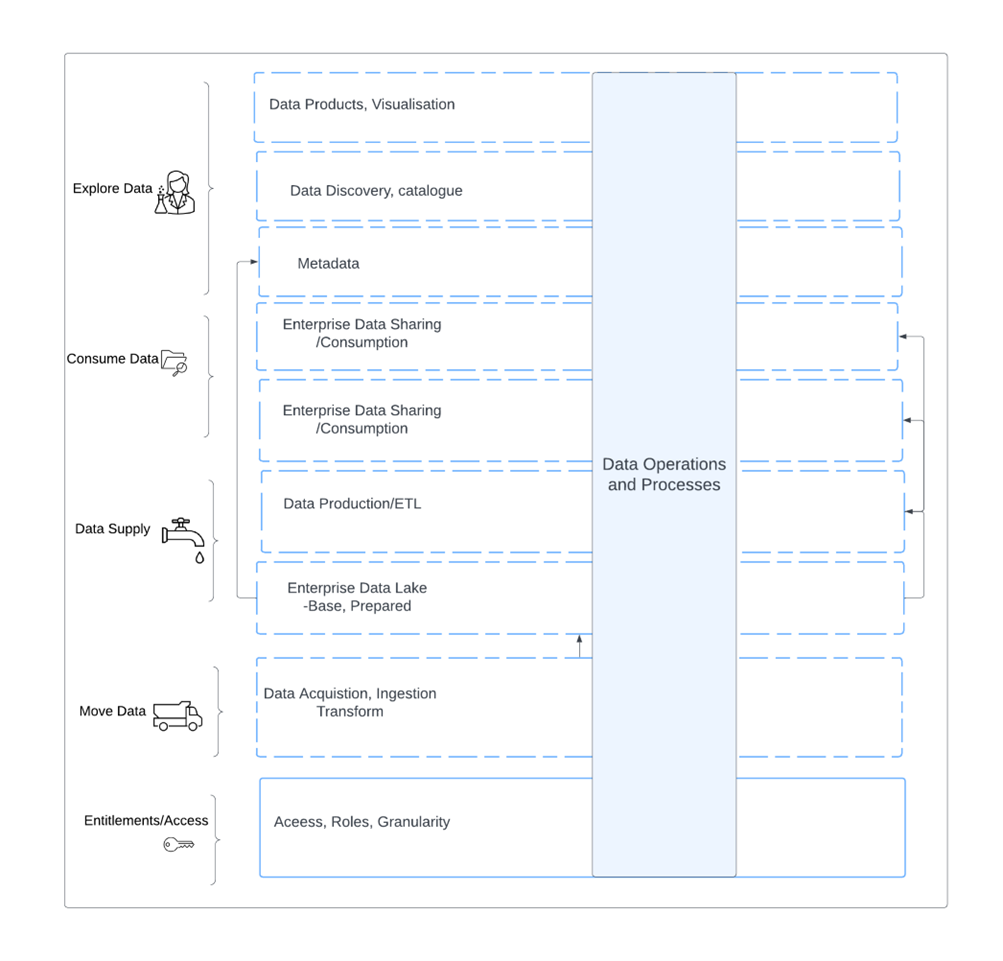
Explanation: The processes are on the left. Each ‘level’ flows into the other starting at the bottom. You could also represent this as a left to right flow (horizontal). Firms often use ‘left to right’, or ‘right to left’ when describing data hydration and automation.
In the above diagram the data operations and related processes are full of manual interventions. These processes would include quality checking, cataloguing, product creation, testing and various approvals. The above diagram is therefore just a grossly simplified 2-D rendering of what is a more complicated process.