Splunk Infrastructure Monitoring provides patterns for high-resolution visibility into AWS infrastructure services such as Amazon Elastic Compute Cloud (EC2), Amazon Elastic Container Service (ECS), and Amazon Elastic Kubernetes Service (EKS). CloudWatch Metric Streams make it easier for customers to gain access to CloudWatch metrics faster and at scale. Instead of polling (which can result in 5 to 10 minutes of latency), metrics are delivered using Amazon Kinesis Data Firehose to target destinations.
With CloudWatch Metric Streams, Splunk now expands this capability for other AWS managed services such as Amazon Elastic Load Balancing Service (ELB), Amazon DynamoDB, Amazon Managed Streaming for Apache Kafka (MSK), and many others.
SIM provides:
- Low-latency visibility into the performance of AWS services, and on-premises deployments from one single solution
- End-to-end streaming analytics — from ingest to insights and action to reduce mean-time-to-detect (MTTD) and mean-time-to-resolve (MTTR)
- Simplified operations — CloudWatch Metric Streams ingestion simplifies architecture removing the need to manage input configuration. Metric Streams can easily be deployed using a CloudFormation template.
- Reduced Cost — CloudWatch Metric Streams pricing offers a 70% lower cost over polling GetMetricData. Metric Streams costs $0.003 per 1,000 metric updates vs. $0.01 for polling GetMetricData for the same number of metric updates.
- Efficient Scaling — Metric Streams eliminates CloudWatch API throttling limits
- Native support for OpenTelemetry,a vendor-neutral framework for collecting, transmitting and storing telemetry data
How to integrate Metric Streams with Splunk Infrastructure Monitoring
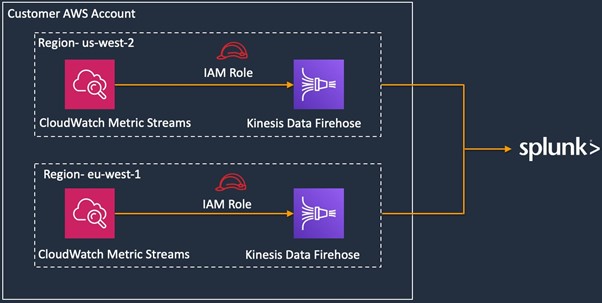
The following diagram shows the schematic representation of CloudWatch Metric Streams integration and how the data flows to Splunk Infrastructure Monitoring. CloudWatch streams performance metrics to region specific Kinesis Data Firehose, which in turn, streams data to Splunk.
Integrating CloudWatch Metric Streams with Splunk Infrastructure Monitoring is a simple 3 steps process:
Step 1: On Splunk Infrastructure Monitoring data setup:
Create an integration with Amazon Web Services by following in-line AWS integration instructions. Update AWS IAM policy to give read access to Metric Streams specific metrics. Uncheck CloudWatch Metrics under the Data Types in the Add Filters to disable CloudWatch polling.
Step 2: On AWS
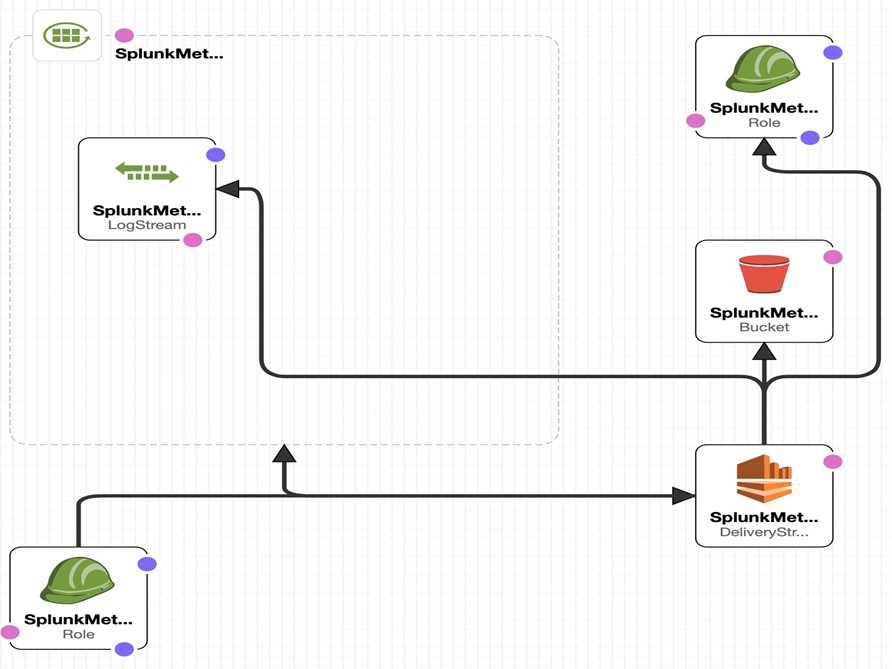
Run appropriate region specific Cloud Formation template to automatically create and configure appropriate IAM roles, S3 buckets, and Kinesis Data Firehose.
Direct links to all available CFN templates are available in our documentation.
Step 3: Turn on the Metric Streams data ingestion
As a final step, make an API call to Splunk and update the integration:
- Do a HTTP Get https://api.<realm>.signalfx.com/v2/integration to get integration object
b. Do a PUT request to the https://api.<realm>.signalfx.com/v2/integration/<integration-id> endpoint and update the payload you got from HTTP Get by adding the following
“metricStreamsSyncState”: “ENABLED”,
“importCloudWatch”: true
Monitor Metric Streams
Metric streams emit CloudWatch metrics about their health and operation in the AWS/CloudWatch/MetricStreams namespace. The following metrics are available to track the number of metrics deposited to Metric Streams:
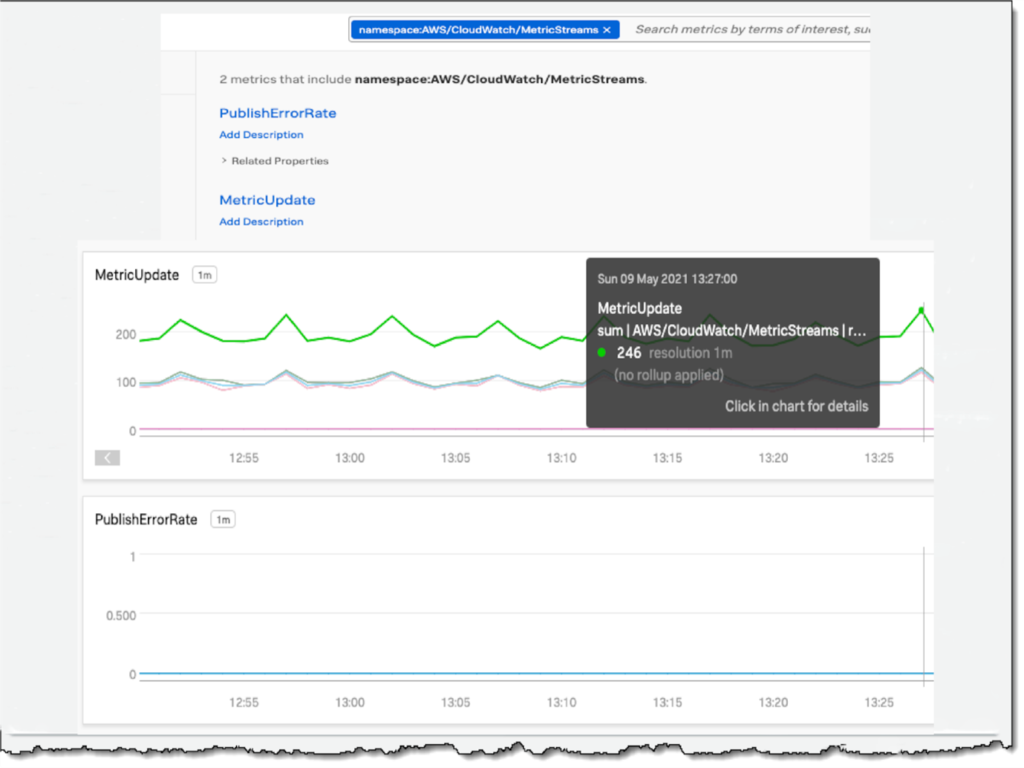
MetricUpdate: The number metric updates sent to the metric stream. If no metric updates are streamed during a time period, a value of 0 is emitted for this metric. Use the statistics function Sum to see the total number of metrics received per time interval.
PublishErrorRate: The number of unrecoverable errors that occur when putting data into the Kinesis Data Firehose delivery stream. If no errors occur during a time period, a value of 0 is emitted for this metric.
Low-Latency Insights With Streaming Architecture
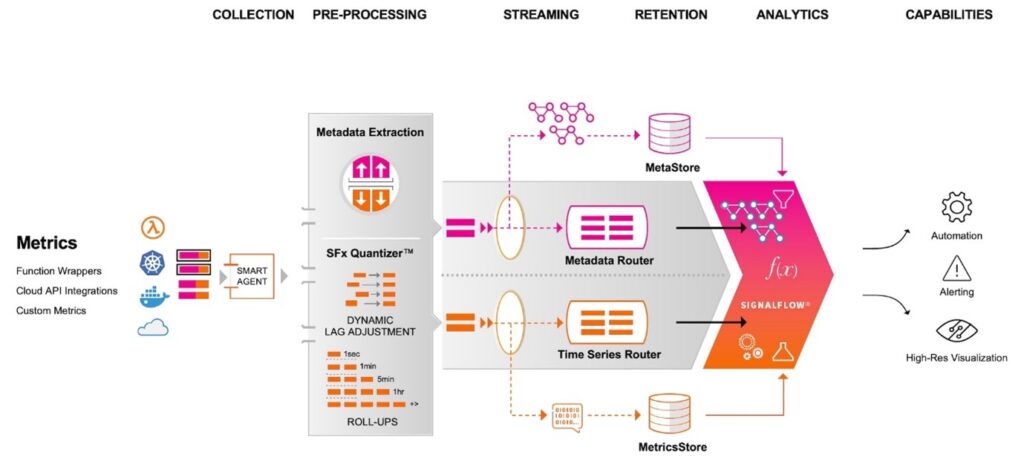
Splunk Infrastructure Monitoring is purpose-built to address the needs of ephemeral cloud, containers, and serverless environments with high-cardinality at massive scale. Driven by our patented streaming architecture, our approach to ingest, store and retrieve data is fundamentally different from traditional batch and query solutions.
As metric data streams into Splunk, metadata is separated from metric value data as they serve separate use cases — human-readable metadata is a central tenant in cloud-native environments to search, filter, sort, and group, while metric values are analyzed by the SignalFlow™ engine and directly streamed to components that need them such as dashboards, alerts, and automation.
In addition, while the data is streaming in the system, data points are rolled up into multiple aggregates for faster analytics and data accuracy by dynamically handling data lag.
This architecture means that you get insights and can take quick action — dashboards refresh, alerts fire, and automation tasks trigger within seconds as compared to tens of minutes with other solutions. Customers have achieved up to 90% faster mean-time-to-detect and improved DevOps productivity by 8x with Splunk Infrastructure Monitoring.
End-to-End Streaming Monitoring Solution
The new support for CloudWatch Metric Streams uses Kinesis Data Firehose to deliver CloudWatch metrics data to Splunk and enables low-latency observability into AWS services. And, with more than 200 out-of-the-box integrations, you can monitor your entire cloud stack from one single solution.